Every 30 seconds, approximately 10 people die from hunger.
Hunger Stats – United Nations World Food Programme
View of Hunger in the World
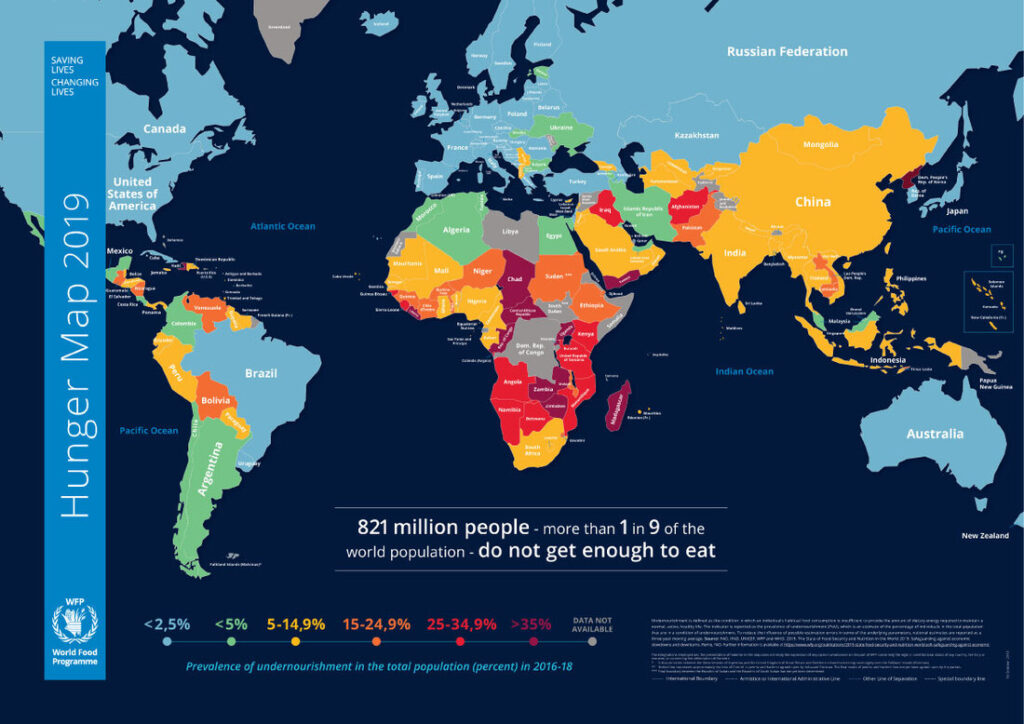
The above map is the “Hunger Map 2019” from the WFP. Its shows the percentage of each countries population that are currently not getting enough to eat (undernourishment). The 4 areas with the most concentrated amount of hunger is in upper South America, Central and Southern Africa, the Middle East region, and the South-East Asian area.
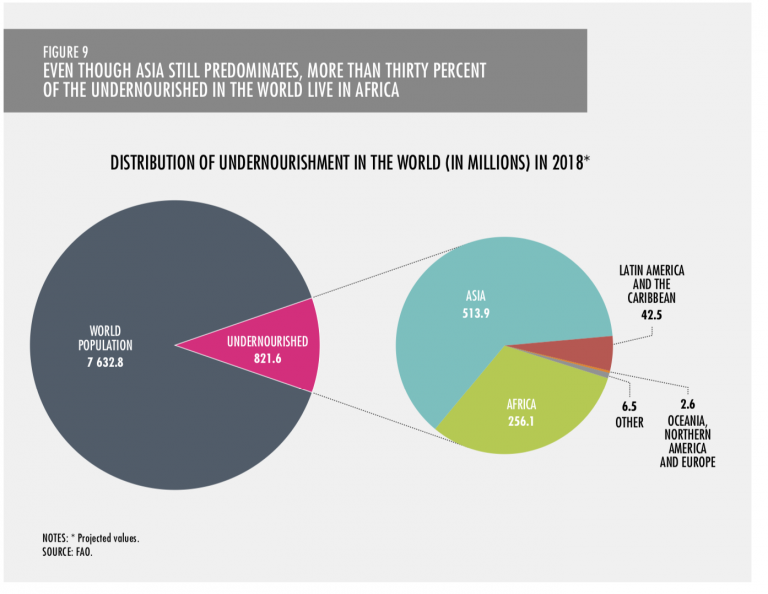
The above graph shows the amount of undernourished people in the world in raw numbers rather than a percentage. Comparing this numbers to the map from the WFP, the two regions that have the highest amount of people that aren’t eating enough is Asia and Africa.

The above graph shows the trendlines for world hunger in millions and as a percentage from 2005 to 2018. Up until 2015, world hunger was making a steady trend down.
Hunger and Obesity

To get a closer look at the some of the hungriest countries by percentage of population, the Central African Republic is the highest at 53%, followed by Yemen and Chad at 46% and 44% respectively, followed by Madagascar at 42% and Zambia at 38%.
Without exception, all continents around the world have had rising overweight rates since 2000. Just from looking at them, it may be shocking how we are currently seeing a rise in undernourishment and a rise in the overweight amount around the world. The reason for this is that food is that the food is concentrated. Even areas with high levels of undernourishment such as Asia and Africa, they have been experiencing a similar wave of obesity.
UN Report on Hunger and Malnutrition
The following is taken from the WHO’s update on SDG #2 during the COVID-19. It is listed under the “Call to action” section.
“The report argues that once sustainability considerations are factored in, a global switch to healthy diets would help check the backslide into hunger while delivering enormous savings. It calculates that such a shift would allow the health costs associated with unhealthy diets, estimated to reach US$ 1.3 trillion a year in 2030, to be almost entirely offset; while the diet-related social cost of greenhouse gas emissions, estimated at US$ 1.7 trillion, could be cut by up to three-quarters.”
It later goes on to talk about how a transformation is needed in all aspects of our food systems to help reduce the cost of nutritious foods to promote healthy diets. A big part becomes focusing on children’s nutrition as the category is in the greatest need of attention. Through education and communication, the WHO believes that we can make the changes needed to reduce the rise in overweight numbers and reduce the cost of healthy food in the areas of the world that need it the most.
Below is the link to the rest of the report summary